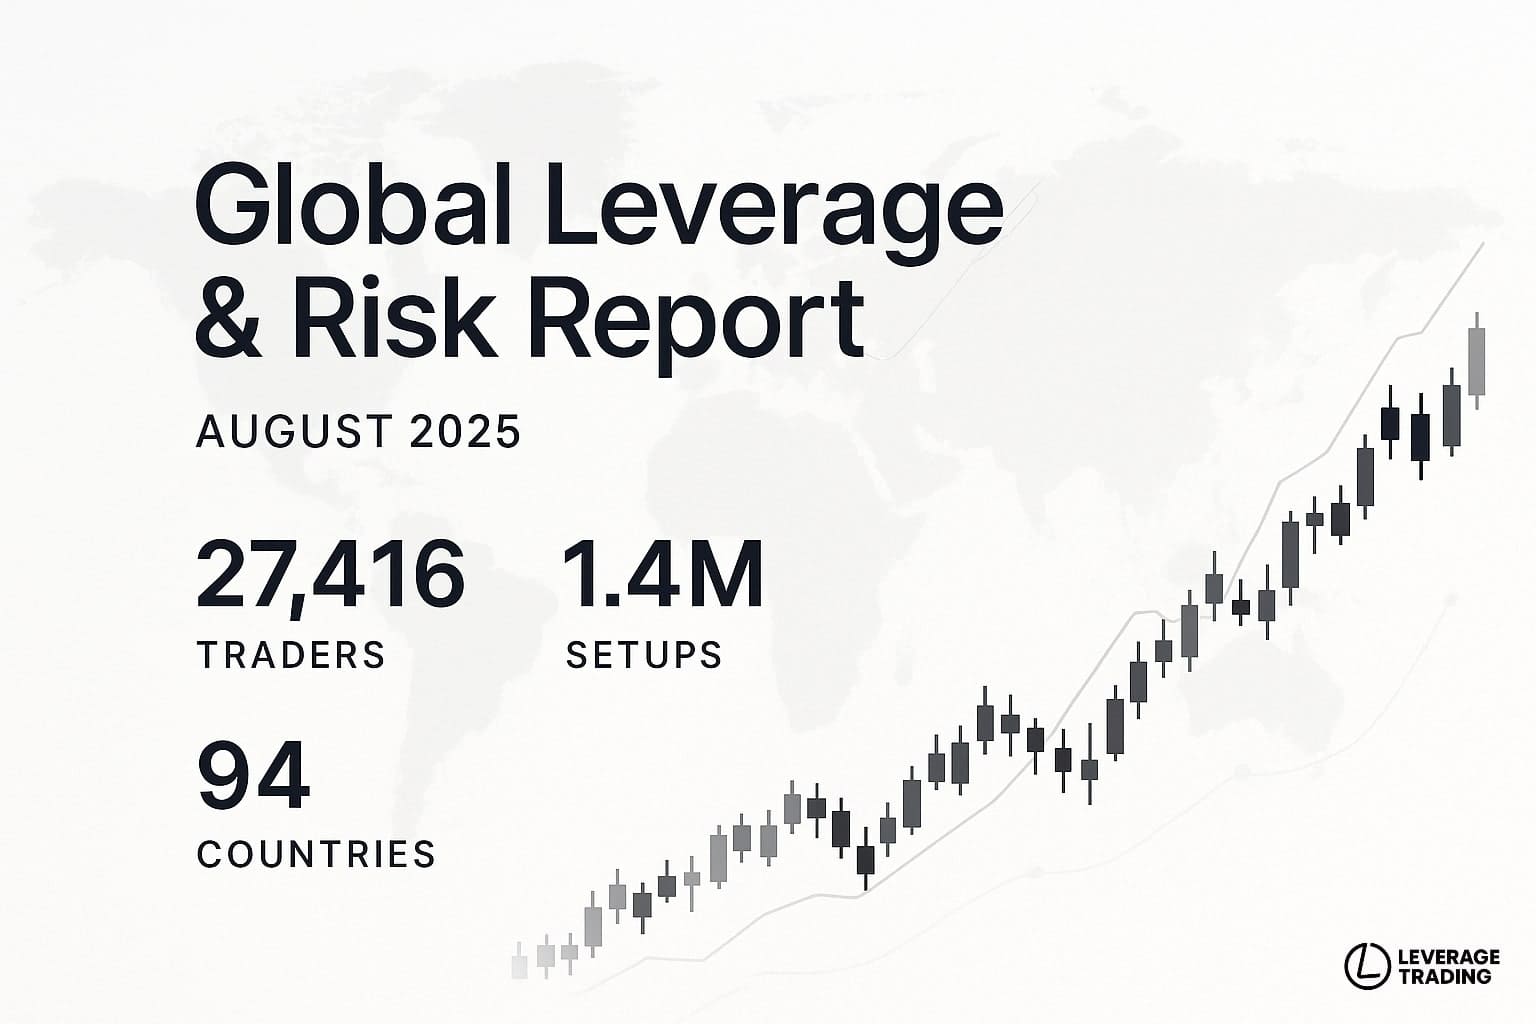
August 2025 — Global Leverage & Risk Report

First-party market intelligence on how traders planned leverage, sized margin, and set risk guardrails across crypto, forex, and equities through July and August. We tracked.

27,416 unique traders 1.4 million trade setups 94+ countries
Leverage & Margin Risk Behavior Report Infographic
Top Story
2025 Mobil dominance

Mobile-First Leverage Trading Hit 85% — Highest on Record

Between 14 July and 14 August, more than four out of five leverage-trading sessions took place on mobile devices — the highest share since tracking began. The spike coincided with sharp intraday swings in Bitcoin (July 17, Aug 5) and global equities (Aug 2), prompting traders to make faster, on-the-go adjustments.

Regional Analysis

14 July → 14 August comparisons

Liquidation-checks Climbs 17.4% Amid July Hack Headlines

Liquidation safety checks accounted for 17.4% of all workflows, up 2.1 points from the prior month. The rise came in the same week CoinDCX reported a security breach and a white-hat returned millions, sparking broader caution in pre-trade risk steps.

Source: First-party telemetry (share of total usage); public incident reports (July 9–15).

India Cross-Asset Sizing Surges 2.2 18.5% as Rupee Pressures Mount

India’s share of multi-market leverage trading rose to 18.5%, outpacing its overall footprint by 2.2 points. Traders blended crypto, FX, and equity sizing as the rupee flirted with record lows in early August.

Source: First-party telemetry (country mix by use case); INR/USD market data.

U.K. Traders Extend Session Depth as FTSE Hits 3-Month High

Dollar-cost average trading depth in the U.K. was 34% higher than the global norm, a 6-point increase from June. The move aligns with more institutional-style workflows during a July rebound in London-listed stocks.

Source: First-party telemetry (engagement by country); FTSE 100 performance data.

Key Findings (Last 30 Days)

Aggregated, anonymized first-party usage signals from 14 Jul → 14 Aug.

U.S. Traders Led Surge in Short-Term Leverage Usage (+9 pp)

U.S. accounted for the highest share of rapid position adjustments, tracking with the S&P 500’s rally post-tariff truce on July 31.

Multi-Asset Sessions Logged 2× Higher Value than Single-Market Moves

Traders sizing crypto and FX in the same session saw double the position value of mono-asset users—mirroring rising Bitcoin-S&P volatility correlation hitting 0.88 on July 24.

Southeast Asia Doubled Stop-Loss Checks Amid Crypto Whipsaw

Stop-loss use in Vietnam and the Philippines nearly doubled as Bitcoin swung sharply following its July 14 record high of $120k.

Risk-Check Activity Jumped 23% During Bitcoin Swings

Usage of liquidation and margin safety tools spiked as BTC volatility surged—driven by late-July options expiry and knee-jerk price moves.

High-Leverage FX Positioning Rose 15% During Dollar Rally

Forex leverage usage climbed mid-August as the U.S. dollar index (DXY) hit a two-month high on August 12, sparking speculative trades in EUR/USD and GBP/USD.

High-Leverage BTC Activity in Turkey Jumped 12% as Lira Hit New Lows

Turkey led EM growth in leveraged Bitcoin usage as the lira tumbled near record lows around July 18–19.

Methodology

Figures are based on aggregated, anonymized first-party telemetry collected from trading tool interactions between July 14 – August 14, 2025. Metrics include device class, country of origin, and engagement behavior, weighted by session intensity. Data reflects actual usage of calculators covering risk management, leverage trading , and position sizing across crypto, forex, and equities. No personally identifiable information (PII) is collected or stored.

About This Dataset

Unlike broker-reported volumes, which show executed trades, this dataset captures pre-trade intent: how traders plan, size, and stress-test positions before placing orders. It offers a rare, upstream look into decision-making that shapes market activity.

Coverage

Insights are drawn from more than 27,416 unique traders in the last 30 days, spanning over 94 countries and all major time zones, and a total of 1,41 million trade setups were analyzed through our systems. The dataset captures both retail and professional usage patterns.